移动阅读
麦霞梅1,胡振琪2,赵艳玲2
(1.国家国防科技工业局重大专项工程中心,北京 100101; 2.中国矿业大学(北京) 土地复垦与生态重建研究所,北京 100083)
摘 要:高潜水位地区煤炭开采破坏导致地表沉陷出现积水和斜坡,沉陷内土壤含水量会分布不均匀,影响农作物的生长,从而严重影响矿区居民的生产和生活。因此大范围快速、精确监测高潜水位地区煤矿开采区的土壤含水量具有重要现实意义。卫星遥感技术可以快速、准确、高效监测矿区土壤含水量。通过遥感手段对高潜水位采煤塌陷地土壤含水量进行监测,探求出一个比较方便、快速、合理监测高潜水位采煤塌陷地土壤含水量分布状况方法,为矿区环境影响评价、农作物估产、破坏等级评价、耕地损害补偿与土地复垦方案的编制提供参考依据。借鉴土壤含水量遥感监测经验,通过野外实地采集土壤样本并测量土壤光谱数据,在室内测量土壤含水量,分析实测地面光谱数据与土壤含水量的变化关系,结合实测的土壤含水量与光谱特征数据,对土壤含水量与实测水体光谱进行相关性分析,得到土壤含水量光谱数据敏感波段范围。结合高分二号卫星影像谱段数据特点,将实测光谱波长按照波段范围划分为与高分二号卫星影像谱段对应的4个波段,即450~520,520~590,630~690,770~890 nm,再取各个波段范围反射率的平均值与土壤含水量光谱反射率进行相关性分析,寻求高分二号卫星影像监测土壤含水量最敏感的波段数据,在确定遥感探测敏感波段的基础上,建立了土壤含水量与光谱反射率的遥感反演模型,即:S曲线模型、逆函数模型,基于预处理的高分二号卫星影像进行沉陷区地土壤含水量遥感反演,从而得到高潜水位采煤塌陷地土壤含水量的空间分布情况。研究结果表明不同土壤含水量的光谱特征基本相似,实测地面光谱数据与土壤含水量的变化关系为土壤光谱反射率随着波长的增长而增大,呈正相关关系;土壤含水量与高分二号卫星影像数据B3波段的反射率具有显著的负相关关系,可将B3波段作为监测土壤含水量最敏感的波段;通过对S曲线模型、逆函数模型进行分析与检验,S曲线模型比逆函数模型更接近实测值;基于高分二号遥感影像,利用S曲线模型进行遥感反演,可以迅速得到高潜水位采煤塌陷地土壤含水量空间等级分布图。
关键词:高分二号;沉陷地;土壤含水量;遥感监测;遥感反演
中图分类号:TD88
文献标志码:A
文章编号:0253-9993(2019)02-0576-06
收稿日期:2018-05-05
修回日期:2018-11-22
责任编辑:韩晋平
作者简介:麦霞梅(1983—),女,广西梧州人,工程师,硕士研究生。Tel:15901480475,E-mail:maixiamei@163.com
通讯作者:胡振琪(1963—),男,安徽五河人,教授,博士生导师。Tel:010-62339045,E-mail:huzq@cumtb.edu
麦霞梅,胡振琪,赵艳玲.基于高分二号卫星影像高潜水位煤矿区沉陷地土壤含水量监测[J].煤炭学报,2019,44(2):576-581.doi:10.13225/j.cnki.jccs.2018.0607
MAI Xiamei,HU Zhenqi,ZHAO Yanling.Monitoring of soil moisture in coal mining subsidence area with high-level groundwater based on the GF-2 satellite image[J].Journal of China Coal Society,2019,44(2):576-581.doi:10.13225/j.cnki.jccs.2018.0607
MAI Xiamei1,HU Zhenqi2,ZHAO Yanling2
(1.The Earth Observation Systems and Data Center of CNSA,Beijing 100101,China; 2.Institute of Land Reclamation and Ecological Restoration,China University of Mining and Technology (Beijing),Beijing 100083,China)
Abstract:Coal mining could destroy and lead to surface subsidence resulting in water accumulation and land sloping in the areas with a high submersible water level.The water content in the subsided soil will not be evenly distributed,which seriously affects the growth of crops,and the life of residents in the mining area.Therefore,it is of practical significance to monitor the soil water content in the coal mining area with a high submersible water level.Satellite RS technology can quickly and accurately monitor the soil moisture content of mining areas.The RS technology is used to monitor the soil water content in the coal mining area with a high submersible water level,and to find a more convenient,rapid and reasonable method for monitoring the distribution of soil water content in the coal mining area with a high submersible water level.It provides a reference for the environmental impact assess-ment of mining areas,crop yield estimation,damage grade evaluation,farmland damage compensation and the compilation of land reclamation plan.Based on the experience of RS monitoring of soil moisture,the soil samples in the field are collected,the soil spectral data are measured and the relationship between the measured ground spectral data and soil moisture is analyzed by indoor soil moisture measurement.Combining the measured soil water content and spectral characteristic data,the correlation between soil water content and measured water spectrum is analyzed to obtain the sensitive band range of soil water content spectral data.According to the characteristics of GF-2 image band data,the measured spectral wavelength is divided into four bands corresponding to the image band of GF-2,namely 450-520,520-590,630-690 and 770-890 nm.Then the correlation between the average reflectance of each band and the spectral reflectance of soil moisture content is analyzed.The most sensitive band data for monitoring soil water content with GF-2 is found.On the basis of determining the sensitive band of RS detection,the RS inversion models of soil water content and spectral reflectance are established,which are S curve model and inverse function model.Then the RS inversion of soil water content in subsidence area is carried out through the pre-processed GF-2,and the spatial distribution of soil water content in coal mining subsidence area with a high groundwater level is obtained.The results show that the spectral characteristics of different soil moisture content are basically similar,and the relationship between measured surface spectral data and soil moisture content demonstrates that the soil spectral reflectance increases with the increase of wavelength and the soil moisture content has a significant negative correlation with the reflectance of GF-2 image data in B3.Therefore,the B3 band can be used as the most sensitive band for monitoring soil water content.Through the analysis and test of S-curve model and inverse function model,the results indicate that S-curve model is closer to the measured value than inverse function model.Based on the RS image of GF-2,using S-curve model for RS inversion,the spatial grade distribution map of soil water content in coal mining subsidence area with a high groundwater level can be quickly obtained.
Key words:GF-2 satellite;mining subsidence;soil moisture;remote sensing monitoring;inversion
我国是煤炭产量最大的国家,煤炭采空后对矿区生态系统产生强烈干扰性,原有生态系统结构和功能遭到破坏,生态环境因子相应发生变化,如岩层结构破坏、土壤含水量、土壤肥力、植被受损、景观生态系统发生变化,土壤含水量是影响矿山植被系统恢复演替的关键环境因子[1]。尤其在东部高潜水位平原矿区,土地沉陷造成了大面积的积水[2],进而土壤含水量发生变化。土壤含水量对农业生产具有不可替代性,直接影响农作物产量,因此沉陷区土壤含水量可作为判定土地损毁程度的重要依据之一。
随着遥感技术的快速发展,特别是高光谱、多光谱遥感技术的发展,利用遥感技术可以获取地表的地物信息。遥感技术探测、识别和区分目标的基础就是利用地物反射电磁波信息的差异性,不同的地物反射光谱、反射强度和波谱曲线的形态都不同[3]。目前国内外学者应用遥感技术对土壤含水量进行探测研究,根据热量平衡、热惯量的原理监测土壤含水量[4-5];利用合成孔径雷达(SAR)具有不受天气影响、穿透能力较强、对含水量敏感等特性,所以通常采用SAR来监测大面积土壤含水量[6-12]。现有关于塌陷地土壤含水量研究对象大多是荒漠化干旱地区的土地,涉及高潜水位煤矿区沉陷地土壤含水量变化的遥感监测研究较少。
由于土壤含水量不同,土壤对电磁波的吸收与反射强度也不同,正是利用这种差异性实现土壤含水量的遥感探测[13-19]。影响土壤含水量光谱特征反射率的因素很多,但在相同的土壤地质环境下土壤含水量是影响光谱反射率特征的主要因素。本研究以山东济宁市境内矿区为研究区域,采用实地光谱仪数据采集与土壤含水量采样测定相结合确定遥感探测的敏感波段及探测模型,基于高分二号卫星影像进行土壤含水量遥感反演,实现对高潜水位采煤塌陷地土壤含水量的遥感监测,探求实时动态大范围土壤含水量探测方法,为高潜水位煤矿区沉陷地农作物估产、土地损毁等级评价、耕地损害补偿等提供参考依据。
研究区位于山东省济宁市东北部,东经116.17°~117.00°,北纬35.17°~35.67°,两个光谱采集和验证区,分别为兴隆庄煤矿西部和南部的桲椤树村东北和南张村东南的采煤沉陷地(图1)。研究区土壤类型为褐土,雨水充足,地下水源丰富,埋深较浅平均约为3~5 m。由于煤炭资源开采,导致地面出现盆地状下沉,地下潜水位抬高,盆底区域出现常年积水,四周呈坡地。

图1 研究区位置
Fig.1 Distribution of sampling sites in the study area
采样时间为11月,研究区农作物已全部收割,冬小麦刚播种,地表植被覆盖度较少,长时间无降雨,土壤含水量受降雨及人工灌溉影响较小。
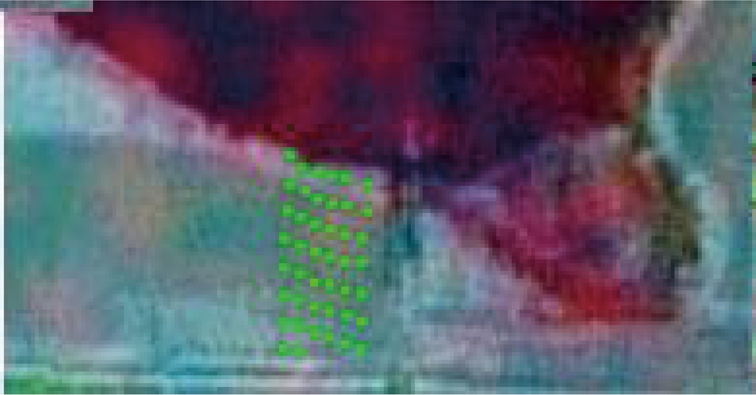
采样仪器为ASD系列的Field spec FSR VNIR便携式地物光谱探测仪。以常年积水区域为中心,采用射线型布网,沿射线垂直于沉陷区域斜坡方向间隔10~15 m均匀布点,每个采样场地布设40~50个点,采取垂直测量的探测方法采集样点的光谱反射率数据,每个样点采集20组数据(图2)。

图2 采点分布
Fig.2 Distribution of sampling sites
在样点光谱反射率数据采集的同时,采集表层(<5 cm)的土壤样品装入铝盒密封,并用手持GPS记录该点坐标。
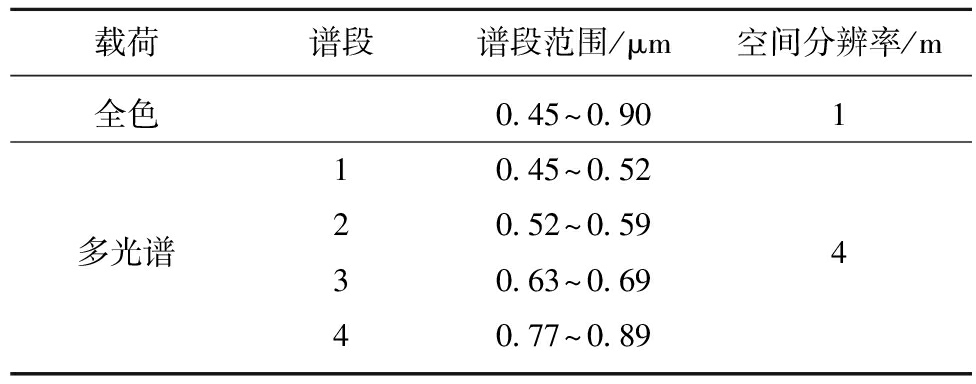
本研究采用我国自主研发的高分辨率光学遥感卫星高分二号卫星影像,与国际同类卫星波段设置基本相同,卫星有效载荷参数见表1。通过数据预处理、最佳波段组合,可较好地实现专题信息提取。影像获取时间为2017-11-08。
表1 高分二号卫星有效载荷参数
Table 1 GF-2 Payload parameters

对每个采样点的20组光谱数据剔除粗差后取均值并转换为反射率,做光谱反射率与土壤含水量的相关分析,找到土壤含水量光谱数据敏感波段范围。不同土壤含水量光谱反射率曲线如图3所示。

图3 不同土壤含水量光谱反射率曲线
Fig.3 Soil moisture content spectrum curves
由图3可以看出,土壤光谱反射率随着波长的增长而增大,呈正相关关系;土壤光谱反射率随着土壤含水量的增加而减小,光谱反射率与土壤含水量呈负相关关系;光谱特征曲线的斜率在波长450~750 nm区间增长较快,说明该波段范围内波段光谱反射率对于不同的土壤含水量反应较为敏感。
通过对土壤含水量与实测水体光谱进行相关性分析如图4所示。

图4 土壤含水量与光谱反射率的相关系数
Fig.4 Correlation coefficient of Soil moisture content and spectral reflectance
由图4 可以看出,在波长为675 nm附近出现最高负相关,在波长为950 nm附近出现最高正相关,说明在这些波段附近的遥感反射率与土壤含水量的相关性比较大。
为实现土壤含水量的遥感探测,必须找到与高分二号卫星遥感数据相应的敏感波段。为便于与高分二号卫星多光谱影像数据进行对应分析,将实测光谱波长按照波段范围划分为4段,即450~520,520~590,630~690,770~890 nm,再取各个波段范围反射率的平均值。对土壤含水量与其光谱反射率进行相关性分析(表2)。
表2 土壤含水量与光谱反射率的相关性分析
Table 2 Correlation analysis between soil moisture content and spectral reflectance

注:*置信水平为0.05的显著相关;**.置信水平为0.01的显著相关。
由表2可知,两个样区B3波段数据与土壤含水量的相关性最大,相关程度为分别为0.493和0.471,均达到统计分析学理论置信度为0.01的相关水平。表明土壤含水量与B3波段的反射率具有显著的负相关关系。可将B3波段作为监测土壤含水量最敏感的波段。
2.3.1 土壤含水量遥感反演模型建立
在确定遥感探测敏感波段的基础上,为了获得最优的土壤含水量遥感探测反演模型,本研究分别建立了S曲线模型、逆函数模型,各模型如下:
S曲线模型:
W=eX+Y/B3(1)
逆函数模型:
W=X+Y/B3(2)
其中,W为土壤含水量;B3为GF-2卫星影像第3波段反射率;X,Y为拟合系数。其目的就是从这些模型中选择最佳光谱变量与土壤含水量的关系模型。各模型的相关系数及F检验值见表3。
表3 土壤含水量与光谱反射率的回归分析
Table 3 Regression analysis of soil moisture content and spectral reflectance

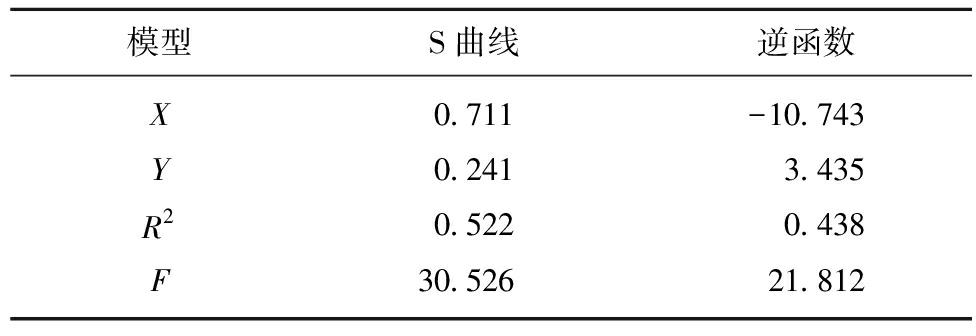
由表3可见,各模型的R2值均通过0.01极显著检验水平。选取最佳模型的标准是既要相关系数通过0.01极显著检验水平,又要其F值较大。因此S曲线模型与逆函数模型可作为探测土壤含水量模型。
2.3.2 反演模型分析
利用剩余的10个点对S曲线模型和逆函数模型进行反演精度分析与拟合验证,以拟合系数R2和预测系数R2相对较高而平均相对误差emr较小为原则,确定土壤含水量与光谱数据的遥感反演模型,得到结果见表4。
(3)
式中,emr为平均相对误差;Xopi为观测值;Xobi为预测值;n为变量个数。
反演精度结果见表4。S曲线模型比逆函数模型更接近实测值,平均相对误差为0.189,小于逆函数模型,即S曲线模型的误差较小。
表4 不同模型的误差对比分析
Table 4 Comparison of different models’ error

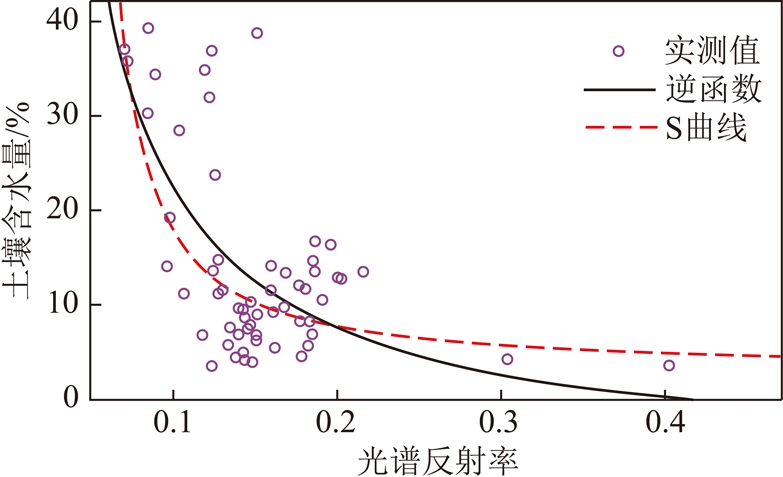
拟合分析结果如图5所示,可以看出S曲线模型的拟合度明显高于逆函数模型,因此本研究采用S曲线模型作为监测土壤含水量与光谱反射率的遥感反演模型。

图5 B3光谱反射率与土壤含水量各模型的拟合曲线
Fig.5 B3 spectral reflectance and soil moisture of the model fitting curves
采用S曲线模型,利用ENVI平台,应用Basic Tools模块中的Band Math窗口输入S曲线模型函数,基于预处理的高分二号卫星影像进行沉陷区地土壤含水量遥感反演,反演结果如图6所示。

图6 土壤含水量空间分布等级
Fig.6 Soil moisture content spatial distribution rank chart
由图6可以看出,土壤含水量总体上呈现出距常年积水塌陷坑越远含水量越小的规律。这与实测土壤含水量统计分析所得的规律基本一致[20]。表明基于高分二号卫星遥感影像,利用S曲线模型反演土壤含水量监测技术可行。
(1)不同土壤含水量的光谱特征基本相似,光谱反射率随着波长增长而增大,呈正相关关系;随着土壤含水量增加而减小,呈负相关关系。
(2)基于高分二号卫星遥感影像进行土壤含水量遥感反演是可行的,B3波段能够较好反演土壤含水量。
(3)建立了基于高分二号卫星遥感影像进行土壤含水量遥感反演S曲线模型。
(4)可使用高分二号卫星遥感影像监测沉陷地土壤含水量,并绘制研究区区土壤含水量的空间等级分布图。
参考文献
[1] 卞正富,雷少刚,金丹,等.矿区土地修复的几个基本问题[J].煤炭学报,2018,43(1):190-197.
BIAN Zhengfu,LEI Shaogang,JIN Dan,et al.Several basic scientific issues related to mined land remediation[J].Journal of China Coal Society,2018,43(1):190-197.
[2] 胡振琪,多玲花,王晓彤.采煤沉陷地夹层式充填复垦原理与方法[J].煤炭学报,2018,43(1):198-206.
HU Zhenqi,DUO Linghua,WANG Xiaotong.Principle and method of reclaiming subsidence land with inter-layers of filling materals[J].Journal of China Coal Society,2018,43(1):198-206.
[3] 常庆瑞.遥感技术导论[M].北京:科学出版社,2004.
[4] JACKSON R D,IDSO S B,REGINATO R J.Canopy temperature as a crop water stress indicator[J].Water Resource,1981,17(1):133-138.
[5] 卞正富,雷少刚,常鲁群,等.基于遥感影像的荒漠化矿区土壤含水率的影响因素分析[J].煤炭学报,2009,34(4):520-525.
BIAN Zhengfu,LEI Shaogang,CHANG Luquan,et al.Affecting factors analysis of soil moisture for arid mining subsidence area based on TM images[J].Journal of China Coal Society,2009,34(4):520-525.
[6] ULABY F T,DUBOIS P C,VAN ZYL J.Radar mapping of surface soil moisture[J].Journal of Hydrology,1996,184(1-2):57-84.
[7] SHI J C,WANG J,HSU A Y,et al Estimation of bare surface soil moisture and surface roughness parameter using L-band SAR image data[J].IEEE Transactions on Geoscience and Remote Sensing,1997,35(5):1254-1266.
[8] ALVAREZ-MOZOS J,CASALI J,GONZALEZ-AUDICANA M,et al.Assessment of the operational applicability of RADARSAT-1 data for surface soil moisture estimation[J].IEEE Transactions on Geoscience and Remote Sensing,2006,44(4):913-924.
[9] 鲍艳松,刘良云,王纪华.综合利用光学、微波遥感数据反演土壤湿度研究[J].北京师范大学学报(自然科学版),2007,43(3):228-233.
BAO Yansong,LIU Liangyun,WANG Jihua.Soil moisture estimation based on optical and microwave remote sensing data[J].Journal of Beijing Normal University(Natural Science),2007,43(3):228-233.
[10] CLARA S Draper,JEFFREY P Walker,PETER J Steinle,et al.An evaluation of AMSR derived soil moisture over Australia[J].Remote Sensing of Environment,2009,113:703-710.
[11] 杨立娟,武胜利,张钟军.利用主被动微波遥感结合反演土壤水分的理论模型分析[J].国土资源遥,2011(2):53-58.
YANG Lijuan,WU Shengli,ZHANG Zhongjun.A model analysis using a combined active/passive microwave remote sensing approach for soil moisture retrieval[J].Remote Sensing for Land & Resources,2011(2):53-58.
[12] 罗时雨,童玲,陈彦.全极化SAR图像的山地低矮植被区域土壤含水量估计[J].遥感学报,2017,21(6):907-916.
LUO Shiyu,TONG Ling,CHEN Yan.Soil moisture estimation for mountainous areas covered with low vegetation using fully polar metric SAR images[J].Journal of Remote Sensing,2017,21(6):907-916.
[13] 张穗,谭德宝,王宝忠,等.TM遥感影像监测裸露土壤含水率的方法研究[J].长江科学院院报,2008,25(1):34-36.
ZHANG Sui,TANG Debao,WANG Baozhong,et al.Method of measuring soil moisture with thematic mapper data[J].Journal of Yangtze River Scientific Research Institute,2008,25(1):34-36.
[14] 丁春林.济阳县潮土光谱特性及含水量估测[D].泰安:山东农业大学,2018.
DING Chunlin.Soil moisture spectral characteristics and moisture content estimation in fluvo-aquic soil in Jiyang County[D].Taian:Shandong Agricultural University,2018.
[15] 魏珍.基于LandsatETM遥感数据的大柳塔煤炭开发区土壤水分信息提取[D].西安:长安大学,2010.
WEI Zhen.The extraction of soil moisture information based on landsat ETM remote sensing data in coal mining zone of Daliuta[D].Xi’an:Chang’an University,2010.
[16] 张鹰,张东,胡平香.海岸带潮滩土壤含水量遥感测量[J].海洋学报,2008,30(5):29-33.
ZHANG Ying,ZHANG Dong,HU Pingxiang.Water content of soil on outcrop beach measured by remote sensing[J].Acta Oceanologica Sinica,2008,30(5):29-33.
[17] 张俊平,胡月明,刘素萍,等.土壤水分空间变异研究综述[J].土壤通报,2009,40(3):683-390.
ZHANG Junping,HU Yueming,LIU Suping,et al.A review on soil moisture spatial variability[J].Chinese Journal of Soil Science,2009,40(3):683-390.
[18] 李琴,陈曦,FRANK Veroustraete,等.干旱半干旱区土壤含水量反演与验证[J].水科学进展,2010,21(2):201-207.
LI Qin,CHEN Xi,FRANK Veroustraete,et al.Validation of soil moisture retrieval in arid and semi-arid areas[J].Advances in Water Science,2010,21(2):201-207.
[19] 吴见,刘民士,李伟涛.干旱半干旱区土壤含水量定量反演技术研究[J].干旱区资源与环境,2014,28(1):26-31.
WU Jian,LIU Minshi,LI Weitao.Research on soil moisture content inversion technologies in arid and semiarid area[J].Journal of Arid Land Resources and Environment,2014,28(1):26-31.
[20] 麦霞梅,赵艳玲,龚碧凯,等.东滩煤矿高潜水位采煤塌陷地土壤含水量变化规律研究[J].中国煤炭,2011,37(3):48-51.
MAI Xiamei,ZHAO Yanling,GONG Bikai,et al.Soil moisture variation in high ground water level coal mining subsidence in Dongtan Coal Mine[J].China Coal,2011,37(3):48-51.